Updated Dec 2025 Author Web3TradingHub Team
Table of Contents
In my advanced trading guide I will be honest with you the first time I opened a trading chart I felt like a pilot trying to fly a plane with no training I slapped on 10 different indicators RSI MACD Bollinger Bands Ichimoku Clouds until I could not even see the price candles anymore
The result I lost money fast if you are stuck in the cycle of win small lose big it is likely because you are trading retail patterns while the institutions are trading liquidity.
In this masterclass we are stripping away the noise we are not just going to define terms we are going to build a professional grade trading system based on Smart Money Concepts SMC Market Structure and Order Flow this is how the top 1% of traders extract profit from the market utilizing proper chart analysis to spot hidden opportunities.
Part 1 Market Structure Understanding Advanced Technical Analysis
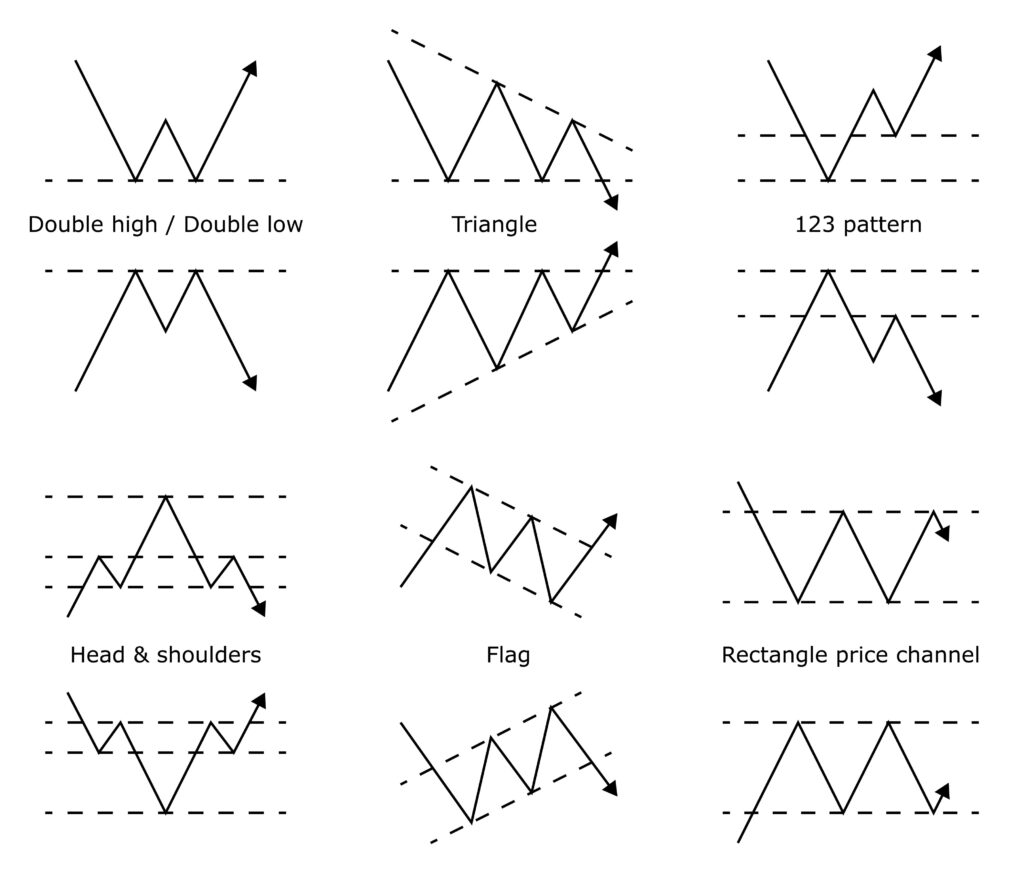
Before you place a trade you need to know where you are are you on a highway which is a trend or stuck in a parking lot which is a range most traders know higher highs and higher lows but in 2025 you need to understand fractal structure which is the foundation of technical analysis.
The 3 States of Price
Expansion Impulse Fast aggressive moves this is where you make money Retracement Pullback Slow choppy moves against the trend this is where you enter Consolidation Range Price is stuck between Support and Resistance do not trade here unless you are scalping
Key Terms You Must Know
BOS Break of Structure When price breaks a previous high in an uptrend or low in a downtrend this confirms the trend is continuing and validates the trend CHoCH Change of Character The first sign of a reversal for example in an uptrend if price fails to make a Higher High and instead breaks the previous Higher Low the Character has changed to bearish
Part 2 Price Action and Candlestick Mastery
Indicators lag price is real time but a candlestick pattern is useless without context a hammer candle in the middle of a range means nothing a hammer candle at a key support level means everything this is where charting tools must be combined
The S Tier Patterns
Focus on these three high probability setups Bullish Engulfing A large green candle completely consumes the previous red candle this shows buyers have overwhelmed sellers The Pin Bar Hammer A small body with a long wick the wick represents rejection sellers tried to push price down but buyers pushed it all the way back up Inside Bar Breakout A small candle contained within the previous one coiling energy the breakout from this usually leads to a violent move
Part 3 Smart Money Concepts SMC
Retail traders use Support lines banks use liquidity
1 Order Blocks OB
An Order Block is a specific candle where institutions placed massive orders Bullish OB The last red candle before a massive explosive move up Strategy When price eventually returns to this candle it often bounces aggressively because institutions have pending Buy Limit orders waiting there
2 Fair Value Gaps FVG Imbalance
When price moves too fast example a huge green candle it leaves a Gap where no trading occurred at certain prices The Theory The market hates inefficiency price will almost always come back to fill this gap before continuing the trend Action Do not chase the pump set your limit order inside the FVG
3 Liquidity Grabs Stop Hunts
Have you ever had your Stop Loss hit only for the price to immediately reverse and go in your direction that was not bad luck that was a Liquidity Grab smart money needs your Stop Loss liquidity to fill their massive orders
Part 4 Advanced Tools Volume Profile and Open Interest
Volume Profile VRVP
Most volume indicators show volume over time x axis Volume Profile shows volume at price y axis .improving your view POC Point of Control The exact price level with the most trading volume this acts as a magnet price will often revisit the POC Value Area Where 70% of the trading happened if price breaks out of the Value Area it usually moves fast to the next node
Open Interest OI
This tracks the total number of open Futures contracts Price Up plus OI Up Strong Trend New money entering Bullish Price Up plus OI Down Short Covering People closing losing trades Weak Trend
Part 5 Divergence Sheet
Divergence is when the Price and the Indicator like RSI disagree this is often the earliest signal of a reversal and a key key part of trading methods Type Price Action Indicator RSI Action Signal Regular Bullish Lower Low Higher Low Strong Buy Reversal Regular Bearish Higher High Lower High Strong Sell Reversal Hidden Bullish Higher Low Lower Low Trend Continuation Buy Hidden Bearish Lower High Higher High Trend Continuation Sell
| Type | Price Action | Indicator (RSI) Action | Signal |
| Regular Bullish | Lower Low | Higher Low | Strong Buy (Reversal) |
| Regular Bearish | Higher High | Lower High | Strong Sell (Reversal) |
| Hidden Bullish | Higher Low | Lower Low | Trend Continuation (Buy) |
| Hidden Bearish | Lower High | Higher High | Trend Continuation (Sell) |
Part 6 The Wyckoff Method Cycle Analysis
Markets move in four phases if you buy during distribution you will hold the bag Accumulation Smart money buys quietly price moves sideways best time to buy Markup The Bull Run price explodes upward Distribution Smart money sells to retail volatility increases but price stalls Markdown The Crash The Spring Pattern In Accumulation look for a Spring a final deep drop below support that shakes out weak hands before the real rally begins this is the ultimate Bear Trap
Part 7 Psychology and Risk Management
You can have the best strategy in the world and still go broke if your mind is weak proper trading analysis requires emotional control
The 1% Rule
Never risk more than 1% of your account on a single trade if you have $10000 your Stop Loss should lose you max $100 this allows you to lose 10 trades in a row and still have 90% of your capital
Revenge Trading
If you take a loss walk away trying to make it back immediately is how traders blow up accounts the market will be there tomorrow. Risk Management
Part 8 The Golden Ratio Fibonacci Retracement
No guide on technical analysis is complete without discussing Fibonacci levels the market moves in waves and these waves often adhere to mathematical ratios derived from the Fibonacci sequence
While some call it magic it works primarily because so many algorithms and traders are watching the same levels making it a self fulfilling prophecy
How to Draw It
In an uptrend you draw the Fibonacci tool from the absolute Swing Low to the Swing High in a downtrend you draw it from the Swing High to the Swing Low
The Golden Pocket
Most traders look at the 0.5 or 50% level but the real magic happens between the 0.618 and 0.65 levels this zone is known as the Golden Pocket Institutional algorithms often place their limit orders in this zone waiting for the price to retrace Strategy Wait for the price to pull back into the Golden Pocket do not buy blindly wait for a confluence factor like a Bullish Engulfing candle or a bounce from an Order Block that aligns with this level combining market structure with Fibonacci is a powerful way to increase your win rate
Part 9 Moving Averages Dynamic Support
While horizontal support and resistance lines are static moving averages are dynamic they move with the price and provide excellent trend confirmation when performing chart analysis on high timeframes
The 200 EMA The King of Trends
The 200 Exponential Moving Average EMA is the line in the sand if the price is trading above the 200 EMA the trend is bullish and you should only look for Longs if the price is below the 200 EMA the trend is bearish and you should look for Shorts
The Golden Cross vs Death Cross
Golden Cross When the 50 MA crosses above the 200 MA this signals the start of a long term bull market Death Cross When the 50 MA crosses below the 200 MA this signals the start of a bear market These signals are lagging but they are highly reliable for long term stock technical analysis and crypto holding strategies
Part 10 Multi Timeframe Analysis
One of the biggest mistakes beginners make is getting tunnel vision on a single timeframe they stare at the 5 minute chart and panic when they see a red candle not realizing that the 4 hour chart is massively bullish this concept is central to proper chart analysis
The Rule of Three
To trade effectively you should analyze three timeframes 1 The Higher Timeframe HTF example Weekly or Daily use this to determine the overall trend and major levels of support and resistance
If the Daily is bullish you should not be looking for shorts on the 5 minute chart 2 The Middle Timeframe MTF example 4 Hour or 1 Hour use this to identify the current market structure and spot Order Blocks or Fair Value Gaps 3 The Lower Timeframe LTF example 15 Minute or 5 Minute use this only for entry triggers looking for a Change of Character CHoCH inside your HTF Order Block By aligning these three you are trading with the wind at your back instead of trying to sail against a hurricane this is how you refine your trading analysis to professional levels
Part 11 Trading Different Asset Classes
While the concepts of Smart Money and price action are universal nuanced differences exist when applying them to different markets understanding these differences is key to mastering technical and analysis across the board
Stock Technical Analysis
When dealing with equities you must consider earnings reports and sector performance market structure in stocks is often cleaner than crypto because of the regulated nature of the market and the immense volume from passive index funds gaps in price at the market open are very common in stocks due to after hours trading
Technical Analysis Shares
For individual shares volume plays a massive role if a breakout happens on low volume in a share price it is likely a trap caused by lack of liquidity always look for relative strength which shares are holding up while the overall index like the S&P 500 is dropping those are the shares you want to buy when the market turns
Equity Technical Analysis
In equity markets correlation is critical unlike crypto where everything follows Bitcoin equities have sectors money rotates from Tech to Energy to Healthcare understanding this rotation is part of advanced equity technical analysis you can use relative strength charts to spot where the smart money is rotating before the price explosion happens
Part 12 Deep Dive into Liquidity
We have mentioned liquidity before but we need to define it clearly because it is the fuel of the market without liquidity the market cannot move understanding liquidity meaning is the difference between being the predator or the prey
What is Asset Liquidity
Asset liquidity refers to how easily an asset can be bought or sold without affecting its price stablecoins have high asset liquidity while a low cap meme coin has low asset liquidity trading low liquidity assets is dangerous because a small sell order can crash the price by 20%
Explain Liquidity in Trading Terms
To explain liquidity simply imagine it as a pool of pending orders resting above highs and below lows smart money cannot fill a $100 million buy order at the current price because there are not enough sellers
So they push the price down below a support level to trigger your stop losses your stop loss is a market sell order which provides the liquidity they need to fill their buy orders This is why you often see a wick below support before a rally that wick was the bank filling their bags using your stop losses identifying these pools is a core skill in market and market structure analysis
Part 13 Building a Trading Journal
You cannot improve what you do not measure technical analysis is a skill that takes years to master but a journal speeds up the process by highlighting your mistakes
What to Track
Date and Time Asset Traded Setup Used example Fibonacci Retracement or Breaker Block Confluence factors did you have chart analysis supporting the trade Emotions how did you feel when entering the trade Outcome Win or Loss Review your journal every Sunday look for patterns maybe you lose 80% of trades taken on Monday mornings maybe you win 90% of trades that use the 200 EMA stop doing what loses money and double down on what makes money this is the essence of trading analysis
Conclusion Putting It All Together
Professional trading is not about guessing it is about building a case using technical and analysis concepts to stack probabilities in your favor
Your New Checklist
Structure Is the higher timeframe market structure Bullish or Bearish Location Is price at a Key Support Order Block or Fibonacci level Trigger Did I see a Reversal Candle or Divergence on the lower timeframe via chart analysis Liquidity Has the market grabbed liquidity from a previous low Risk Is my potential reward at least 2x my risk If the answer to all five is Yes take the trade if not sit on your hands cash is a position too mastering technical analysis shares stocks or crypto requires the same discipline the chart is just a visual representation of human psychology and psychology never changes
Frequently Asked Questions FAQ
Q Which timeframe is best for Technical Analysis A Top Down Analysis is best start on the Weekly Daily to find the trend use the 4 Hour to find key levels Order Blocks and use the 15 Minute for entry triggers performing thorough chart analysis on all three
Q Do Smart Money Concepts work on all assets A Yes SMC works on Crypto Forex and stock technical analysis because it is based on human psychology and liquidity which are universal market constants
Q What is the best indicator for beginners A The RSI Relative Strength Index is the most versatile master Divergence on RSI before adding complex tools like Ichimoku Clouds to your technical and analysis toolkit
Q How do I identify a Fakeout A A fakeout usually happens on low volume if price breaks a resistance level but Volume decreases it is likely a trap a real breakout should have a massive spike in Volume confirming the market and market structure
Q Can I apply these concepts to equity technical analysis A Absolutely equity markets respect support resistance and supply demand zones just as much as crypto the only difference is the market hours and gaps
Q What is liquidity meaning in simple terms A Liquidity meaning is simply the availability of buyers and sellers at a specific price level high liquidity means you can trade instantly low liquidity means you might get stuck
Q Can you explain liquidity regarding stop hunts A To explain liquidity in stop hunts it is when price moves to a level where many traders have placed stop loss orders to generate the volume needed for institutions to enter their positions
Q Why is asset liquidity important A Asset liquidity ensures you can exit a trade when things go wrong without suffering massive slippage ensuring your risk management remains intact
Financial Disclaimer
The information provided on Web3TradingHub is for educational purposes only I am not a financial advisor trading cryptocurrencies and financial assets involves high risk and the potential loss of capital Technical Analysis is a probability tool not a crystal ball always conduct your own research DYOR and manage your risk properly